Dashboard Overview
The Bizaldo Dashboard provides a real-time overview of your business performance. From a single screen, you can view today's sales, track order volume, monitor inventory levels, and identify emerging trends.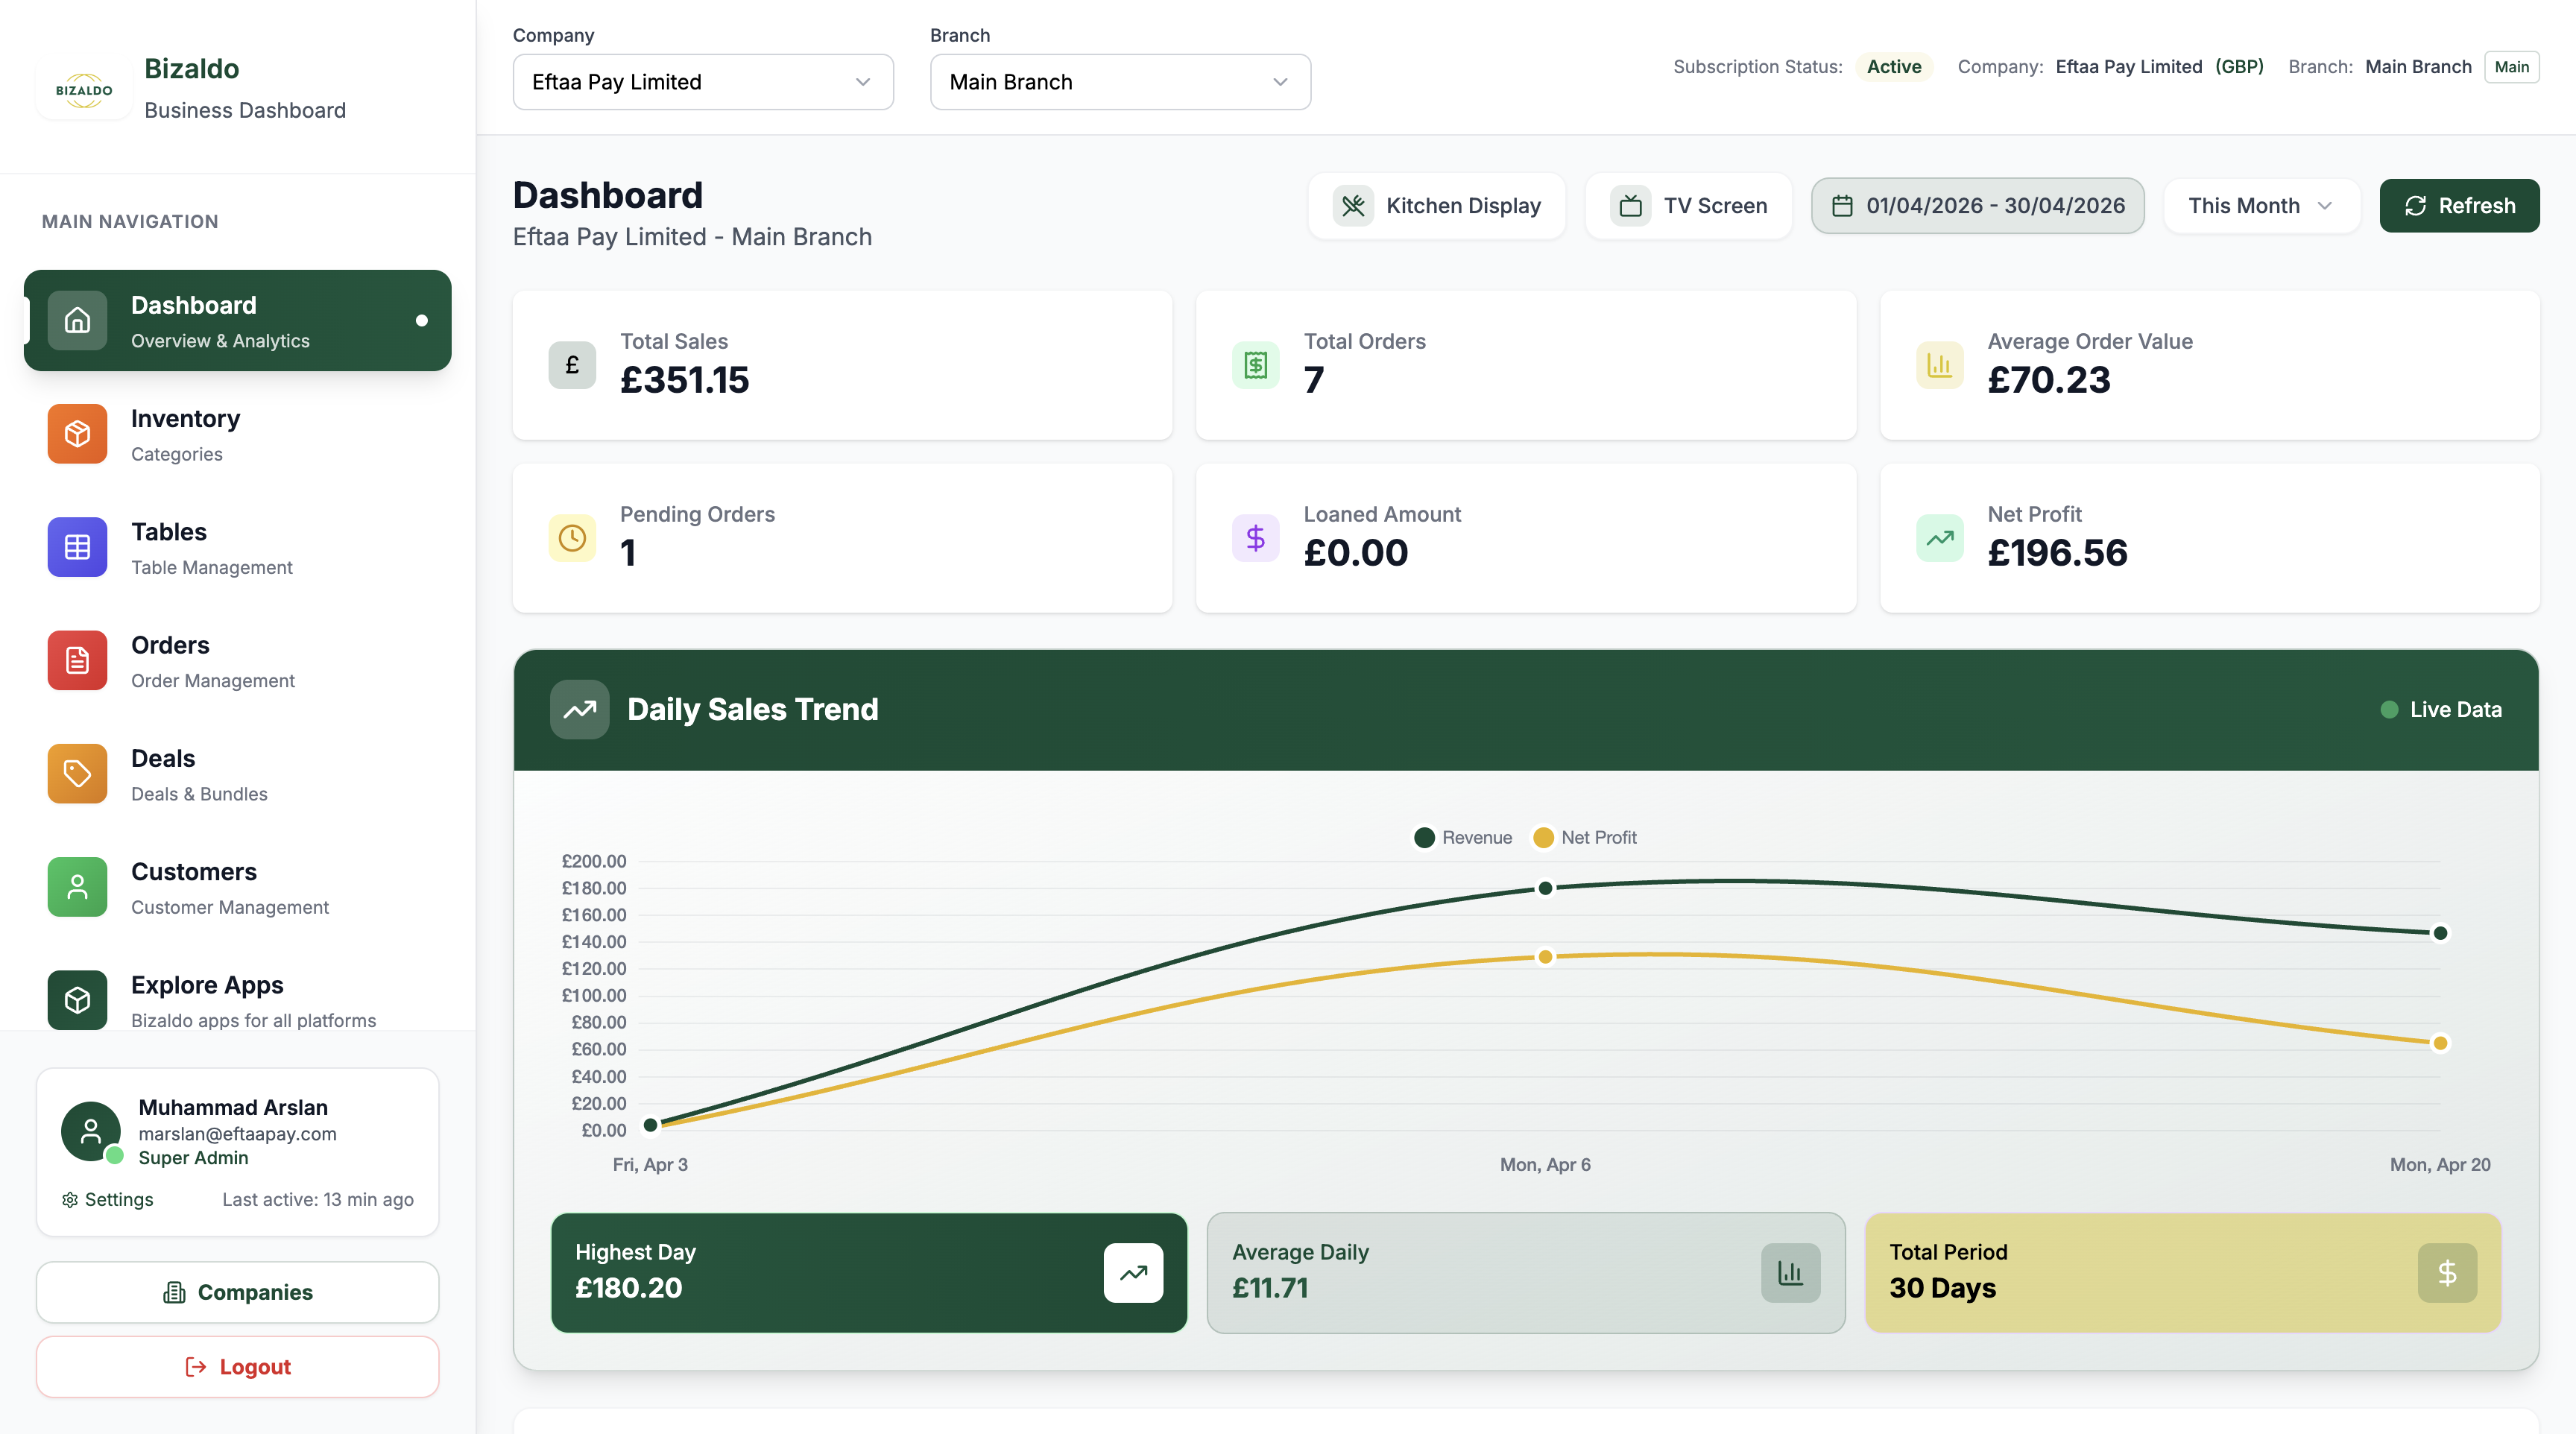
Figure 1 — The Bizaldo Dashboard with key areas highlighted
Screen Elements
Access Dashboard, Forecasting, Purchase Orders, Suppliers, and administrative functions.
Shows current company and branch: 'EftaaPay Limited - Main Branch'.
Date range picker showing '01/05/2026 - 31/05/2026' with 'This Month' dropdown for filtering dashboard stats.
Launch Kitchen Display, TV Screen, and Refresh dashboard data.
Sales metrics: Total Sales (€351.15), Orders (7), AOV (€70.23), Pending (1), Loaned (€0.00), Net Profit (€196.56).
Interactive chart showing Revenue and Net Profit over time with live data indicator.
Shows Highest Day (€180.20), Average Daily (€11.71), and Total Period (30 Days) metrics.
Access Super Admin profile, Settings, Companies, Report Issue, and Logout.
 12345678910
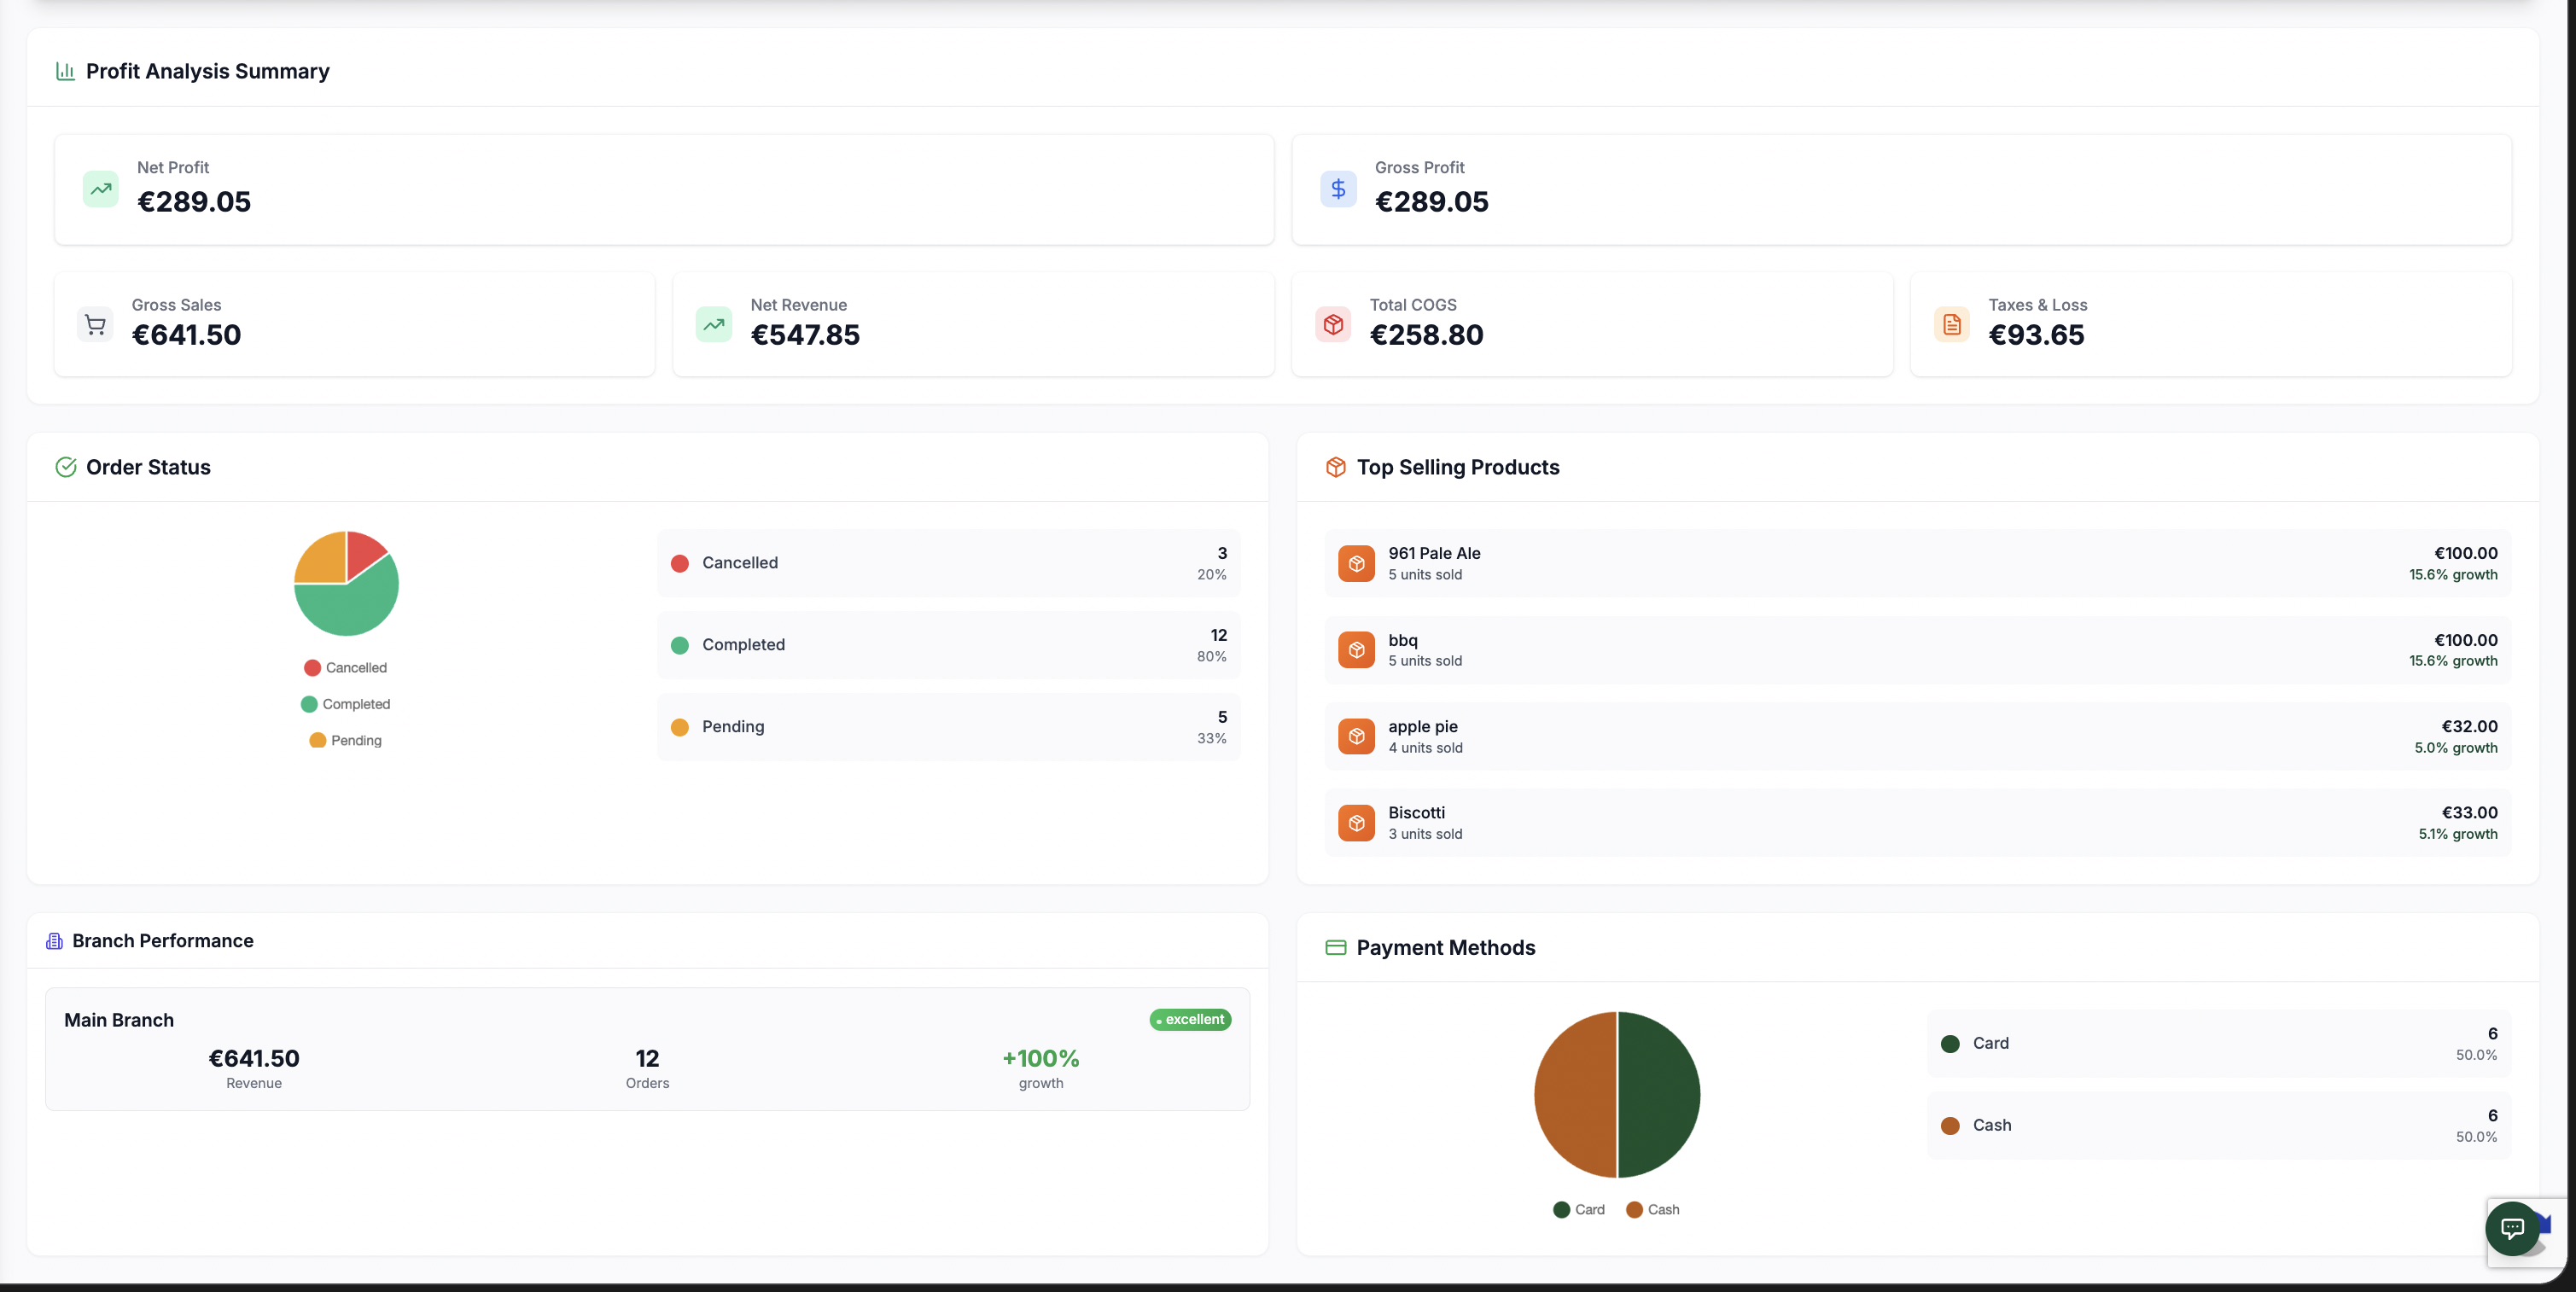
Figure 2 — Complete dashboard layout with all metrics and sections
Screen Elements
Detailed profit breakdown showing Net Profit (€289.05), Gross Profit (€289.05), Gross Sales (€641.50), Net Revenue (€547.85), Total COGS (€258.80), and Taxes & Loss (€93.65).
Net profit of €289.05 after all deductions and expenses.
Shows gross profit amount of €289.05 for the selected period.
Total gross sales amount of €641.50 before deductions.
Cost of Goods Sold totaling €258.80.
Total taxes and losses amounting to €93.65.
Visual representation showing order distribution with percentages.
Best-selling products list with sales units and growth percentages.
Performance metrics for current branch including sales and order data.
Breakdown of payment methods used by customers.
What the Dashboard Displays
Based on Figure 2, the dashboard provides comprehensive business insights with the following key sections:Profit Analysis Summary
The detailed profit breakdown shows:- Net Profit: €289.05 after all deductions and expenses
- Gross Profit: €289.05 for the selected period
- Gross Sales: €641.50 before deductions
- Net Revenue: €547.85 after initial deductions
- Total COGS: €258.80 (Cost of Goods Sold)
- Taxes & Loss: €93.65 total taxes and losses
Sales Metrics
The top section displays six key performance metrics:- Total Sales: €351.00 — Total revenue from all orders in the selected period
- Total Orders: 7 — Number of orders processed in the selected period
- Average Order Value: €70.23 — Average revenue per transaction
- Pending Orders: 1 — Number of orders awaiting completion
- Loaned Amount: €0.00 — Total amount loaned to customers
- Net Profit: €196.56 — Profit after subtracting costs and expenses
Order Status
Visual representation showing order distribution:- Completed orders: 6 orders (86%)
- Cancelled orders: 1 order (14%)
Top Selling Products
Best-selling products list with performance data:- 961 Pale Ale: 3 units sold, €60.00 revenue, 25% growth
- Other top performers with sales units and growth percentages
Branch Performance
Performance metrics for the current branch including:- Sales data and order statistics
- Branch-specific performance indicators
- Comparative analysis tools
Payment Methods
Breakdown of payment methods used by customers showing:- Payment type distribution
- Transaction volume by method
- Popular payment preferences
Period Summary Cards
Below the sales trend chart, summary cards display:- Highest Day: €180.20 (best single-day performance)
- Average Daily: €11.71 (average revenue per day)
- Total Period: 30 Days (duration of selected date range)
- Which days are busiest
- Revenue trends over time
- Seasonal fluctuations
- Payment method preferences
- Product performance patterns
How the Dashboard Updates
The dashboard refreshes automatically:- Sales Metrics — Updates every 60 seconds with latest order data
- Sales Chart — Cached for 5 minutes for performance optimization
- Period Summary — Recalculated when date range changes
Dashboard Layout
See the annotated screenshot at the top of this page (Figure 1) for a visual guide to every area of the dashboard. Hover over the numbered markers or read the legend below the image for details.Key Features
Date Range Selection
The dashboard allows flexible date filtering:- Use the date range picker to select custom periods
- Choose from preset options like "This Month"
- View performance for any date range
- All metrics and charts update based on selected period
Quick Actions
Access key functions directly from the dashboard:- Kitchen Display — Launch kitchen display system (Quick Actions)
- TV Screen — Display order status on TV for customers (Quick Actions)
- Refresh — Manually refresh all dashboard data
Real-time Updates
The dashboard shows live data with:- Automatic refresh every 60 seconds
- Live data indicator on the sales chart
- Instant updates when new orders are processed
In One Sentence
The dashboard is your command center—monitor sales performance, track financial metrics, and analyze business trends in real-time.Key Actions
| Action | How To |
|---|---|
| Refresh data | Click refresh button or wait for auto-update |
| Change date range | Use date range picker in top-right |
| Launch Kitchen Display | Click Kitchen Display button → KDS guide |
| View on TV | Click TV Screen button → TV guide |
| Navigate to other sections | Use sidebar menu |
Outputs
The dashboard produces:- Visual metrics — Real-time KPI cards showing Total Sales, Orders, AOV, Pending Orders, Loaned Amount, and Net Profit
- Sales chart — Interactive Revenue and Net Profit chart with live data
- Period summary — Highest Day, Average Daily, and Total Period metrics
- Date-filtered data — All metrics update based on selected date range
Related Documentation
- Sales Forecasting — Predict future trends
- Inventory Optimization — Advanced inventory insights
- Customer Analytics — Customer behavior analysis
- Reports — Detailed business reports