Tablet Dashboard
On the Bizaldo Tablet POS app, the Dashboard is the default screen that provides shift managers and operators with real-time operational data. The dashboard is divided into three key analytical areas: Session Overview, Booking Overview, and Analytics.Where to find it: Tap Dashboard (grid icon) at the top of the left navigation sidebar of the Tablet POS app.
Session Overview
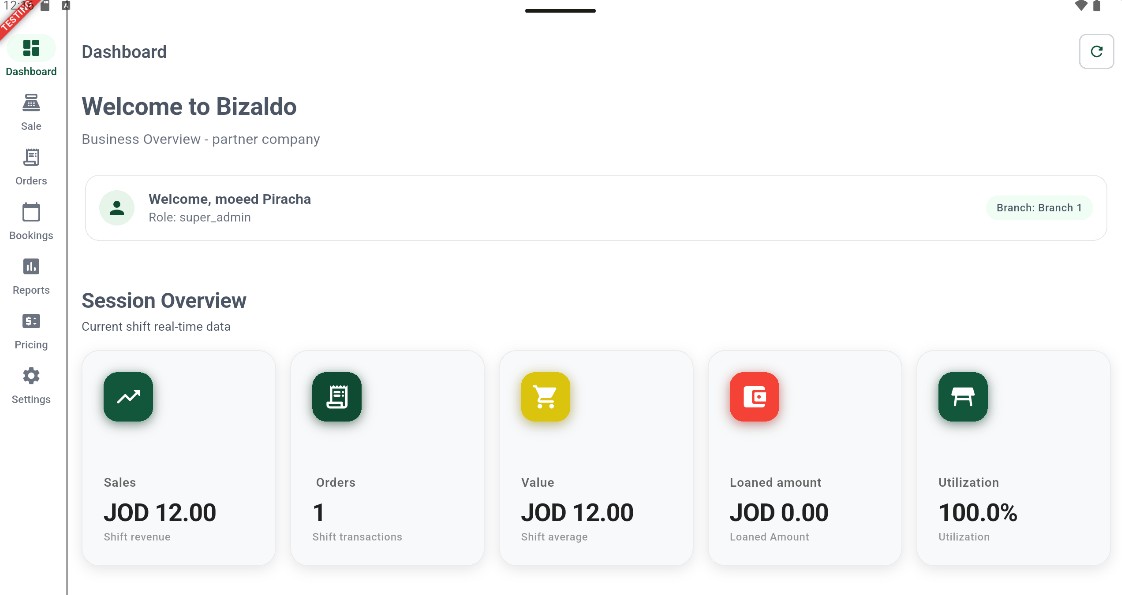
The Session Overview card row displays live transaction metrics for the active shift.Session-Based Stats: The metrics in this section are calculated strictly on the basis of the current day session. They begin tracking when the day session is opened (Start Day) and are finalized and reset when the day session is closed (Close Day).
 123456
Figure 1 — Session Overview: real-time shift sales, transaction counts, averages, BNPL, and table utilization
Screen Elements
Shows the currently logged-in user profile, security role (e.g. super_admin), and active branch.
Total shift revenue (e.g. JOD 12.00) collected during the active day session.
Total transaction count for orders finalized in the active day session.
Average transaction value (Total Shift Sales ÷ Total Shift Orders) for this session.
Total outstanding Buy Now, Pay Later (BNPL) credit issued during this shift.
Percentage of restaurant tables currently occupied by active guest sessions.
Booking Overview
The Booking Overview section displays reservation statistics and table booking status. Operators can filter reservations by day to anticipate service load.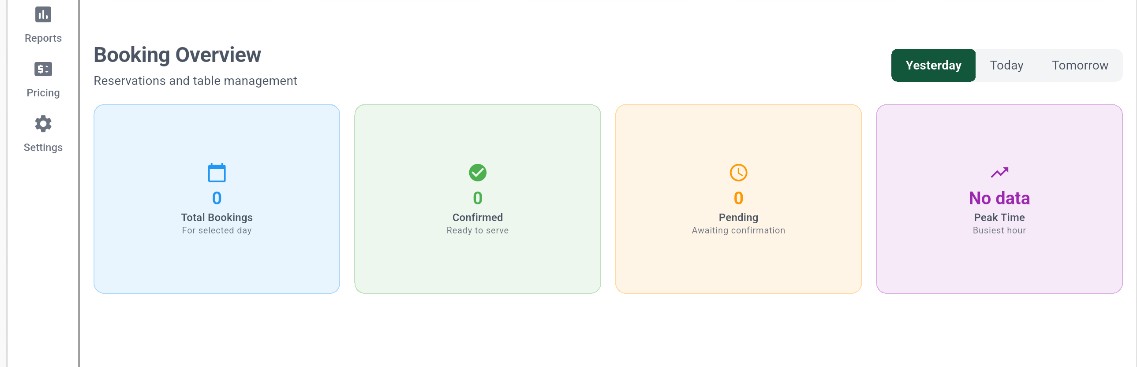 12345
12345Figure 2 — Booking Overview: reservation volumes, confirmed/pending status, and busiest hours
Screen Elements
Tap to filter bookings by date range presets: Yesterday, Today, or Tomorrow.
Total number of table reservations scheduled for the selected day.
Reservations marked as confirmed and ready for guests to arrive.
Reservations awaiting host review or staff confirmation.
Displays the busiest hour of the day based on guest booking density.
Analytics
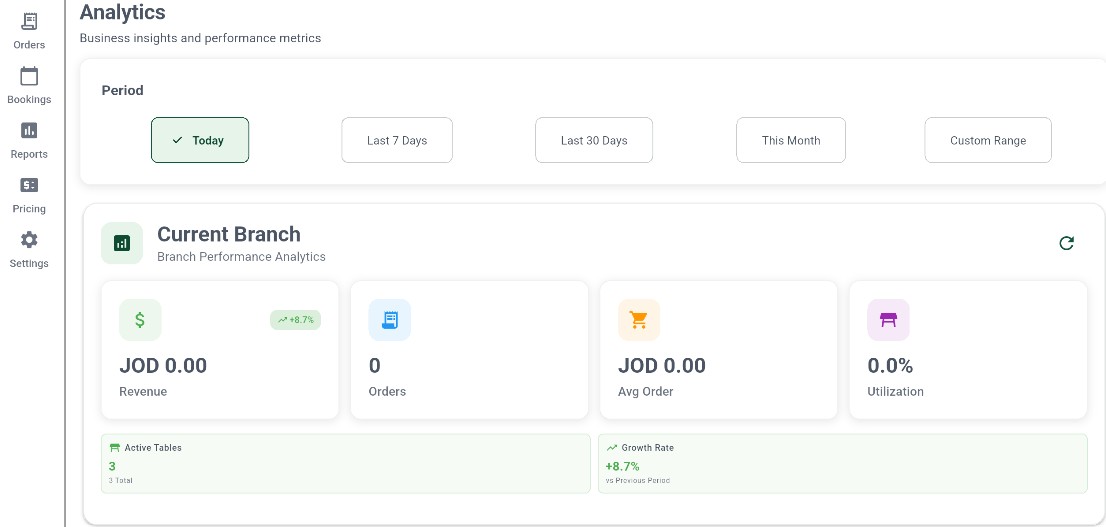
The Analytics screen displays consolidated performance metrics and business insights for the current branch.Period Filtering: Unlike the shift-bound Session Overview, the Analytics panel can be filtered for historical comparison. Tap any of the preset buttons (Today, Last 7 Days, Last 30 Days, This Month, or Custom Range) to instantly update the charts and metrics.
 1234567
Figure 3 — Analytics screen: period-filtered revenue, orders, growth rates, and active tables
Screen Elements
Tap to filter analytics stats by Today, Last 7 Days, Last 30 Days, This Month, or a Custom Range.
Aggregated sales revenue for the selected period, complete with a growth indicator badge (e.g., +8.7%).
Total completed order count across the selected time period.
Average transaction value (Revenue ÷ Orders) for the selected period.
Average table occupancy rate across the selected timeframe.
Shows the number of restaurant tables currently active vs. total tables configured.
Compares current period performance against the previous period (e.g., +8.7% vs Previous Period).
Key Actions
| Action | How To |
|---|---|
| Refresh dashboard data | Tap the circular refresh icon in the top-right |
| Filter reservation bookings | Tap Yesterday, Today, or Tomorrow on the Booking Overview card |
| Filter analytics period | Tap Today, Last 7 Days, Last 30 Days, This Month, or Custom Range on the Analytics card |
| Navigate sidebar tabs | Tap the sidebar navigation icons |
Outputs
The Tablet Dashboard produces:- Session Overview KPIs — Real-time sales, order counts, value, loaned amount, and table utilization for the active shift
- Booking Overview stats — Scheduled, confirmed, and pending reservation counts for the selected day
- Analytics KPIs — Period-filtered revenue totals, average order value, growth rate vs. previous period, and active tables count
Related Documentation
- Dashboard Overview — Web administration dashboard features
- POS Reports — Detailed business reports and day-session histories
- Table Management — Floor plan layouts and active customer table tracking